
Save time in Excel with Copilot
30 July 2026
Learning Pathway:
AI Apply 201: Everyday Tasks
Use Copilot in Excel to save time on formatting, formulas, and data analysis.

Today's Exercise
Copilot in Excel can format and transform data, create summaries, and highlight trends, so you spend less time on routine tasks and more time on decisions.
Imagine you have an Excel file with citizen feedback data. Each row shows a citizen feedback, whether it has been resolved, and the date it was resolved. Rather than formatting the sheet manually, we will ask Copilot to do the work for us.
Let's use Copilot in Excel to:
Format data
Add new columns
Create a dashboard
Here's what you need for this exercise
Tools and inputs required:
🛠️ Tool | Excel |
🔗 Feature | Copilot Chat in Excel |
📂 Your input | Your Excel file. Use this sample for this exercise: sample citizen feedback data [XLSX, 21.40 KB] (opens in new tab) |
1. Format data with Copilot
Let's say you want to use Copilot to highlight unresolved feedback cases.
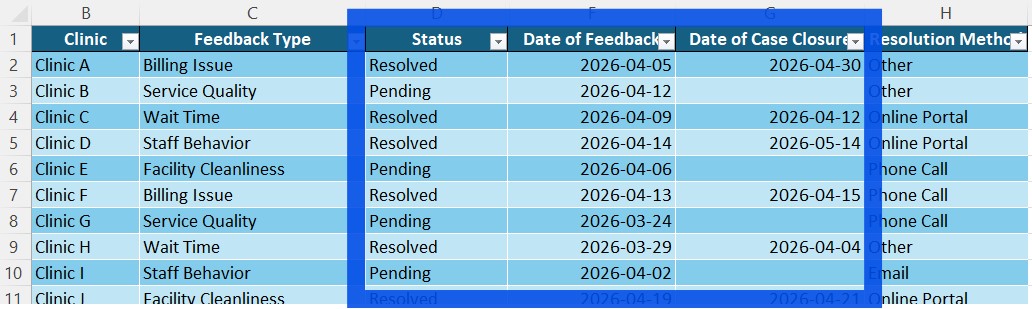
☑️ Open your Excel sheet. For our example, we have rows of Feedback with:
Status: Resolved or Pending
Date of Feedback
Date of Closure
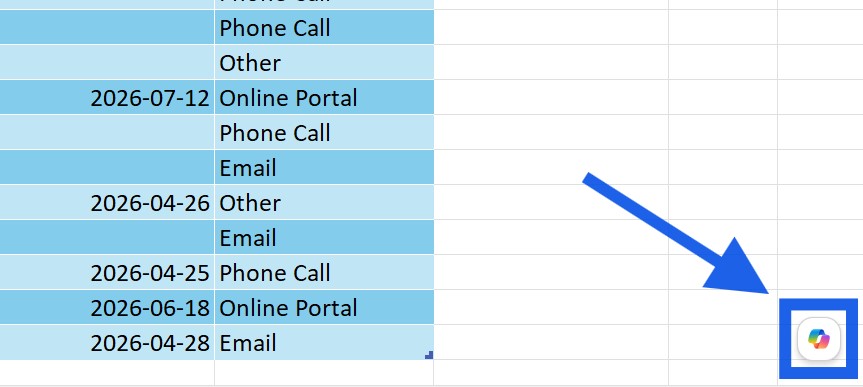
☑️ Open Copilot in the bottom right
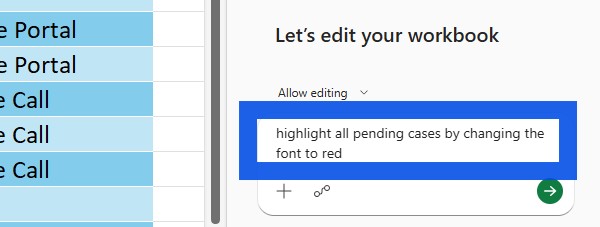
☑️ Ask Copilot to "highlight all pending cases by changing the font to red".
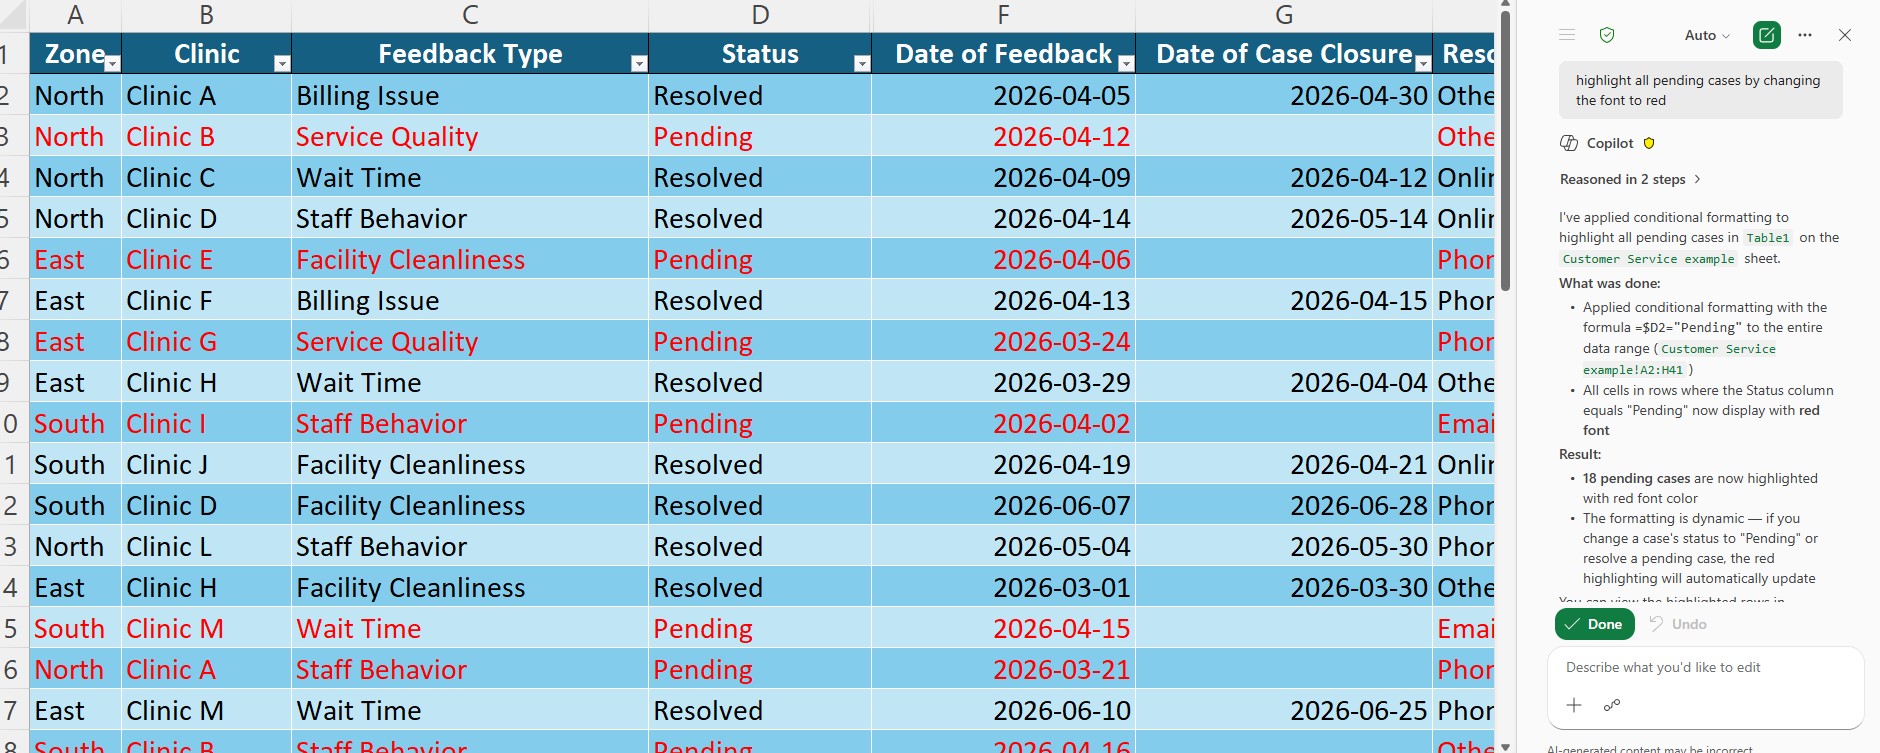
☑️ Copilot will change the formatting, without any manual effort on your part.
2. Adding new columns of data
Let's say you want to know the number of days that have passed since each feedback was received.
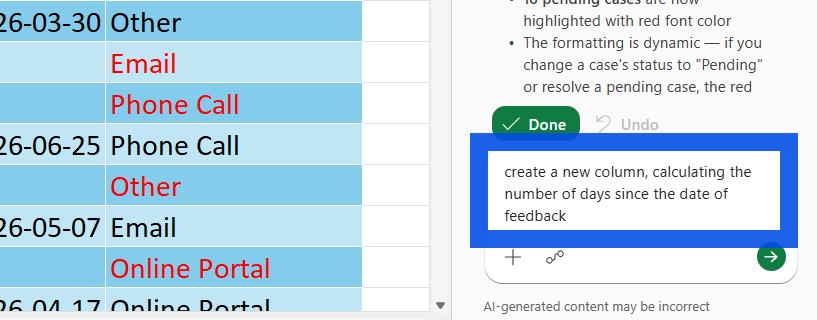
☑️ Ask Copilot to "create a new column, calculating the number of days since the date of feedback".
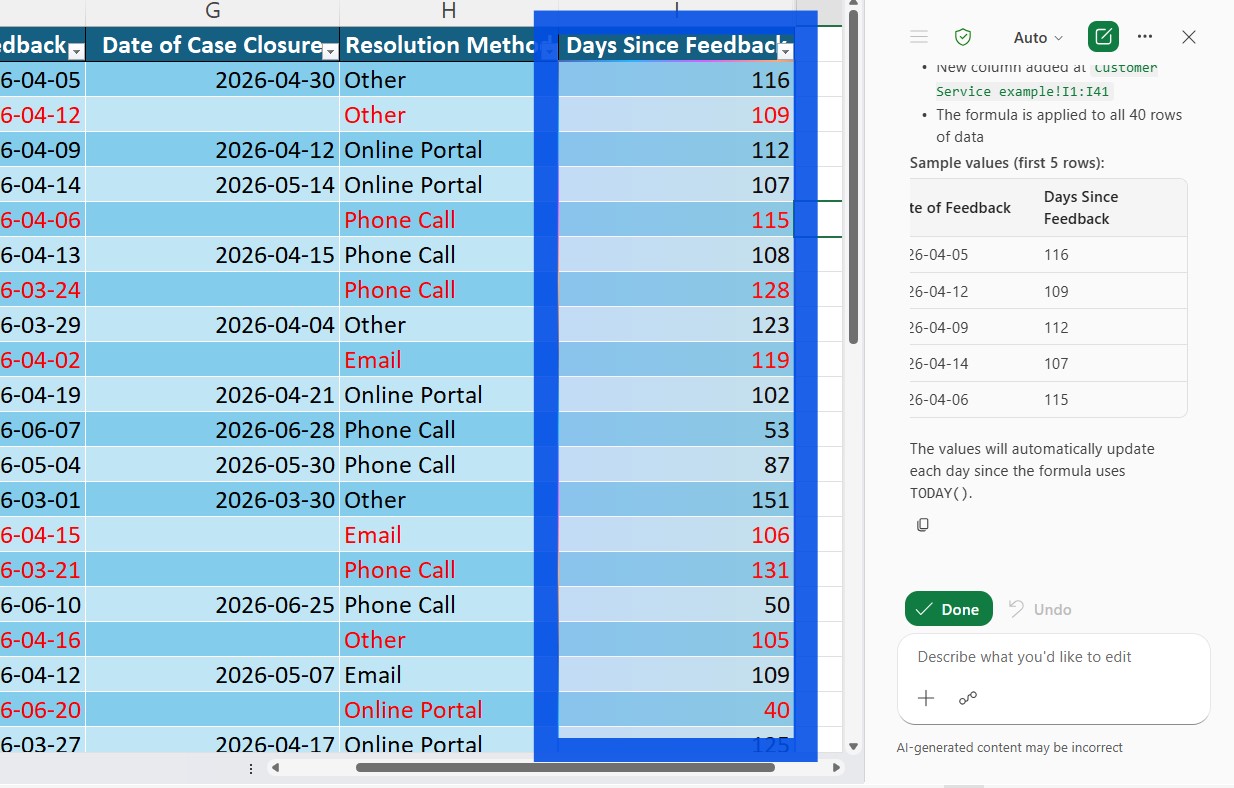
☑️ Copilot will create the additional column of data.
3. Create a dashboard
You can also get Copilot to analyse and visualise your data on a new sheet.
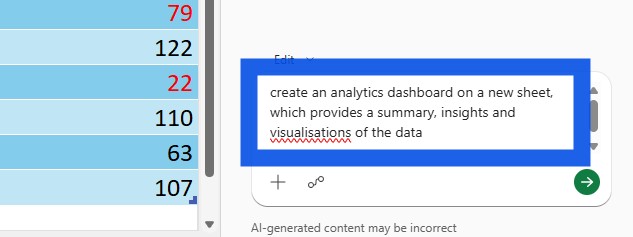
☑️ Ask Copilot to "create an analytics dashboard on a new sheet, which provides a summary, insights and visualisations of the data"
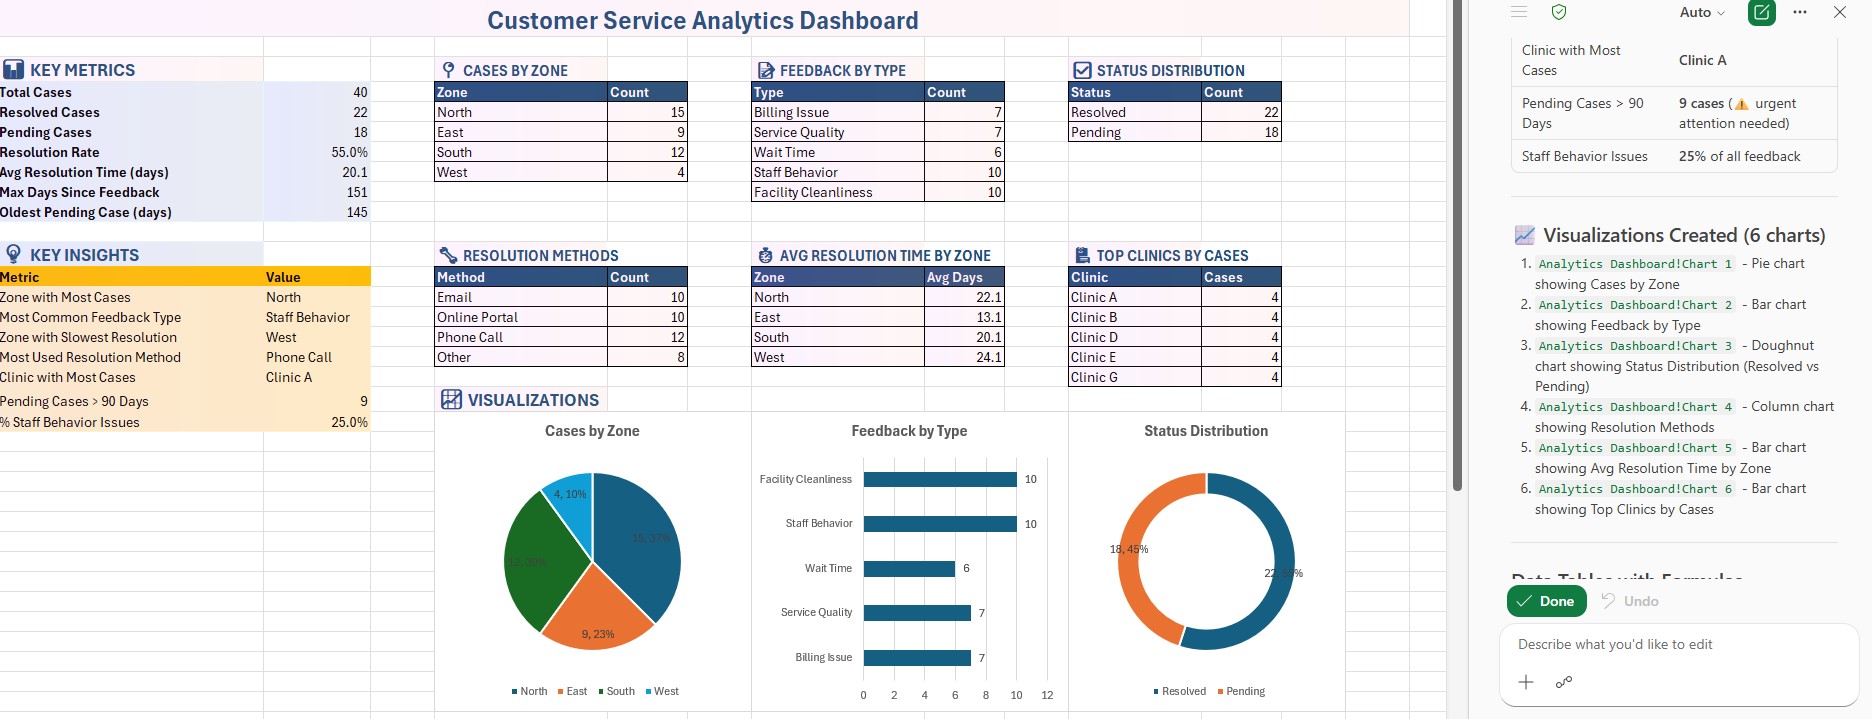
☑️ Review the generated dashboard, and continue chatting with Copilot to make changes.
Now it's your turn to try!
Try this out on other spreadsheets, such as project trackers, finance records, HR lists, or inventory logs. With prompts such as:
“Group the rows by category and show the count for each group.”
“Summarise the main patterns or trends in this workbook in plain English.”
“Add a column which calculates the difference between the two date fields.”
The best way to learn is to try, test different prompts, and see what works best for your Excel tasks.